Visualizing Call Graphs in C Language Projects with Doxygen and Graphviz
Analyzing and documenting C language projects becomes more complex as the project scale grows.In particular, understanding call relationships between functions is crucial for code comprehension and maintenance.This article introduces how to automatically generate call graphs for a C language project by combining Doxygen, an open-source documentation generation tool, and Graphviz, a graph visualization tool, using a signature scheme based on Post-Quantum Cryptography (PQC).
Overview of Doxygen and Graphviz
-
Doxygen: A documentation generation tool supporting many programming languages such as C, C++, and Java.It can generate API documentation from comments in the source code.
-
Graphviz: A tool for drawing graph structures, which works with Doxygen to generate call graphs and class diagrams.
Environment Setup
-
Installing Doxygen:
-
macOS:
brew install doxygen -
Ubuntu:
sudo apt-get install doxygen
-
-
Installing Graphviz:
-
macOS:
brew install graphviz -
Ubuntu:
sudo apt-get install graphviz
-
- Clone MAYO:
- git clone https://github.com/PQCMayo/MAYO-C.git
Editing the Doxygen Configuration File (Doxyfile)
Run the following command to create the base configuration file:
doxygen -g
Edit the Doxygen configuration file, Doxyfile, and configure the following items:
PROJECT_NAME = "MAYO-C"
OUTPUT_LANGUAGE = Japanese-en
EXTRACT_ALL = YES
INPUT = src
RECURSIVE = YES
SOURCE_BROWSER = YES
CALL_GRAPH = YES
CALLER_GRAPH = YES
HAVE_DOT = YES
DOT_PATH = /usr/bin/dot
-
EXTRACT_ALL: Includes all functions and variables in the documentation target. -
INPUT: Specifies the directory containing the source code. -
RECURSIVE: Analyzes including subdirectories. -
CALL_GRAPHandCALLER_GRAPH: Generates function call relationship diagrams. -
HAVE_DOTandDOT_PATH: Settings for using Graphviz’s dot command.
Generating and Verifying Documentation
Once configuration is complete, generate the documentation with the following command:
doxygen Doxyfile
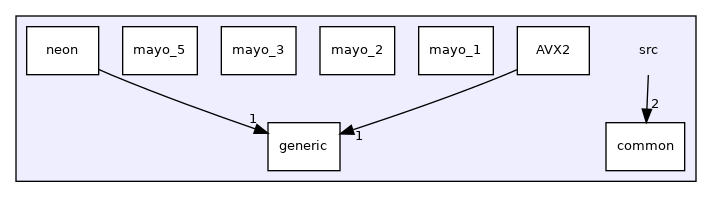
The generated documentation is typically output inside the html directory.By opening index.html in a browser, you can visually check function call graphs and the source code structure. Below is the dependency graph for the src directory.
Notes and Best Practices
-
Adding proper Doxygen-style comments to functions and structures improves documentation quality.
-
If you also want to document static functions, set
EXTRACT_STATIC = YES. -
In large-scale projects, the generated graphs can become complex. You can control graph complexity by adjusting settings such as
MAX_DOT_GRAPH_DEPTHandDOT_GRAPH_MAX_NODES.
Conclusion
Leveraging Doxygen and Graphviz makes it easier to visually grasp function call relationships in C language projects.This enables more efficient code comprehension and maintenance.This effect is particularly remarkable when analyzing cryptographic libraries like MAYO-C.