Monitoring CPU Temperature from the Browser on Ubuntu Server by Installing Cockpit and cockpit-sensors
On our previously operated PT3 recording server, we experienced an issue where a sudden cooling fan failure caused the CPU to overheat, leading to a system halt due to thermal runaway.
When running small form-factor PCs or spare PCs continuously as home servers, heat tends to get trapped inside the chassis, and fan degradation or blocked airflow directly leads to fatal hardware failures. This made us acutely realize the importance of setting up an environment where abnormal temperature rises can be detected routinely rather than reacting only after a failure occurs.
Therefore, this time, we decided to set up “Cockpit", a web-based console tool, on an environment running Ubuntu Server 26.04, and build a monitoring system that allows us to easily check hardware status and temperatures remotely via a browser.
Building an Environment to Check CPU Temperature and Hardware Status Just by Opening a Browser
The objectives and goals for hardware monitoring of the home server are as follows:
- Objective: To eliminate terminal-based CUI operations in order to detect early signs of trouble, enabling centralized management and remote monitoring of server resource status and hardware health via a web browser.
- Goal: To completely eliminate the hassle of logging in via SSH and executing commands each time, making it possible to check the temperature of each CPU core in real time simply by opening Cockpit in a web browser.
Limits of Cockpit’s Standard Features and the Hurdle of Installing Third-Party Plugins
Cockpit is a very lightweight and easy-to-handle foundation as a tool for easily managing Linux servers from a browser. However, in its default state, while Cockpit can visualize CPU and memory usage, disk I/O, and network traffic, it lacks the functionality to view hardware “temperature" or “fan speed".
Furthermore, even when searching the official Ubuntu apt repositories, the temperature monitoring package (cockpit-sensors) is not officially included.
Consequently, it is necessary to install lm-sensors on the OS side to retrieve motherboard and CPU temperatures, and then manually download a third-party plugin developed and published by the community on GitHub, correctly extracting and deploying it to Cockpit’s system directory.
Setup Procedure for Cockpit and cockpit-sensors
Starting from an environment where the installation of Ubuntu Server 26.04 is complete, we will proceed with setting up Cockpit itself and deploying the temperature monitoring plugin.
Installing and Enabling Cockpit
Install Cockpit from the official repository and enable socket activation so that the process starts only when accessed.
sudo apt update
sudo apt install cockpit -y
sudo systemctl enable --now cockpit.socket
If you have enabled a firewall such as UFW, open the web console’s listening port (9090).
sudo ufw allow 9090/tcp
Installing lm-sensors and Auto-Detecting Sensors
To read temperature data from the hardware layer, install lm-sensors and automatically scan for hardware sensors.
sudo apt install lm-sensors -y
sudo sensors-detect --auto
Once the scan is complete, verify whether temperature information is being retrieved normally in the terminal.
sensors
If temperatures for each CPU core (such as Core 0: +50.0°C) are outputted, the preparations on the OS side are complete.
Downloading and Manually Deploying cockpit-sensors
Obtain the release archive from the GitHub repository (ocristopfer/cockpit-sensors) and place it in /usr/share/cockpit/sensors, which is the storage destination for Cockpit plugins.
# Download the release archive
wget https://github.com/ocristopfer/cockpit-sensors/releases/download/1.1/cockpit-sensors.tar.xz

# Extract the dist directory from the archive
tar -xf cockpit-sensors.tar.xz cockpit-sensors/dist

# Deploy as the plugin directory
sudo mv cockpit-sensors/dist /usr/share/cockpit/sensors

# Clean up the archive
mv cockpit-sensors.tar.xz cockpit-sensors/
After deployment, verify that the files within the directory are in a state where they can be correctly read by the web service.
Visualizing Temperature in the Web UI and the Challenge of Scrolling Discovered During Operation
Access the following URL from your browser and log in with a regular Ubuntu user account:
https://<Server IP Address>:9090
A new item named “Sensors" will be added under “Tools" in the left sidebar menu. Opening this tab displays the CPU temperatures retrieved via lm-sensors in a card format, allowing real-time monitoring of each core temperature from Core 0 to Core 3.
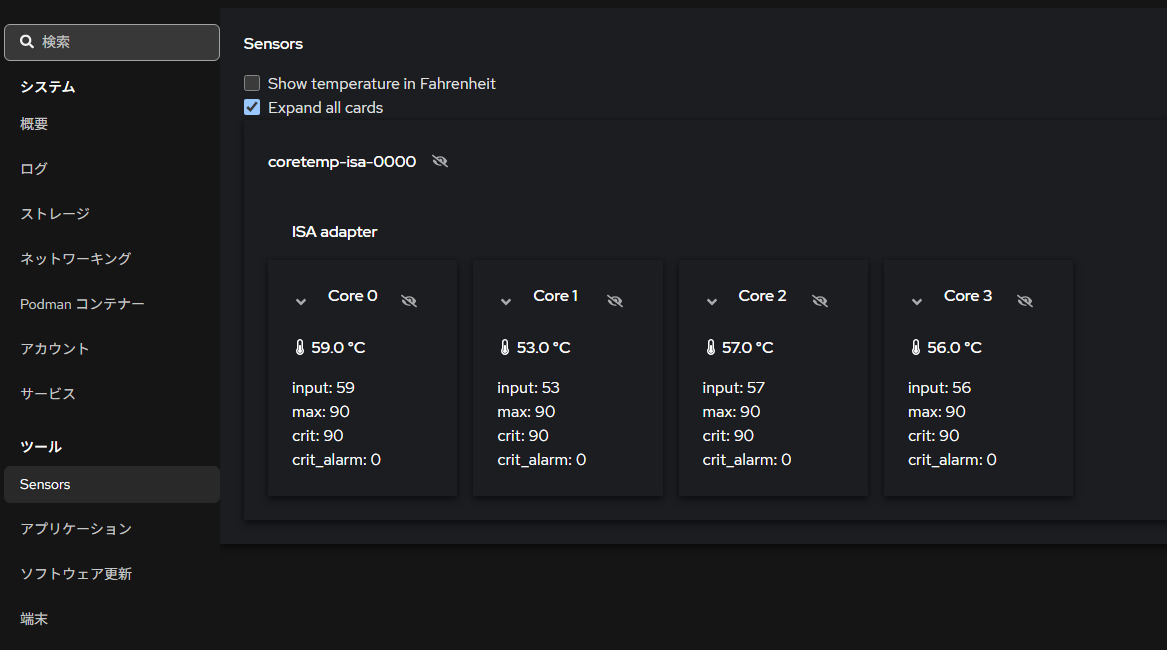
Without needing to log in via SSH and run the sensors command, we can now track CPU temperature trends simply by opening a browser, successfully realizing our target remote monitoring environment.
On the other hand, when running the same plugin on another machine with a large number of sensors (such as PCH, battery, or configurations with multiple interfaces), a new issue came to light. When the detected cards were aligned vertically, a vertical scrollbar failed to appear within the Cockpit screen frame, resulting in sensor information placed at the bottom being cut off from view.
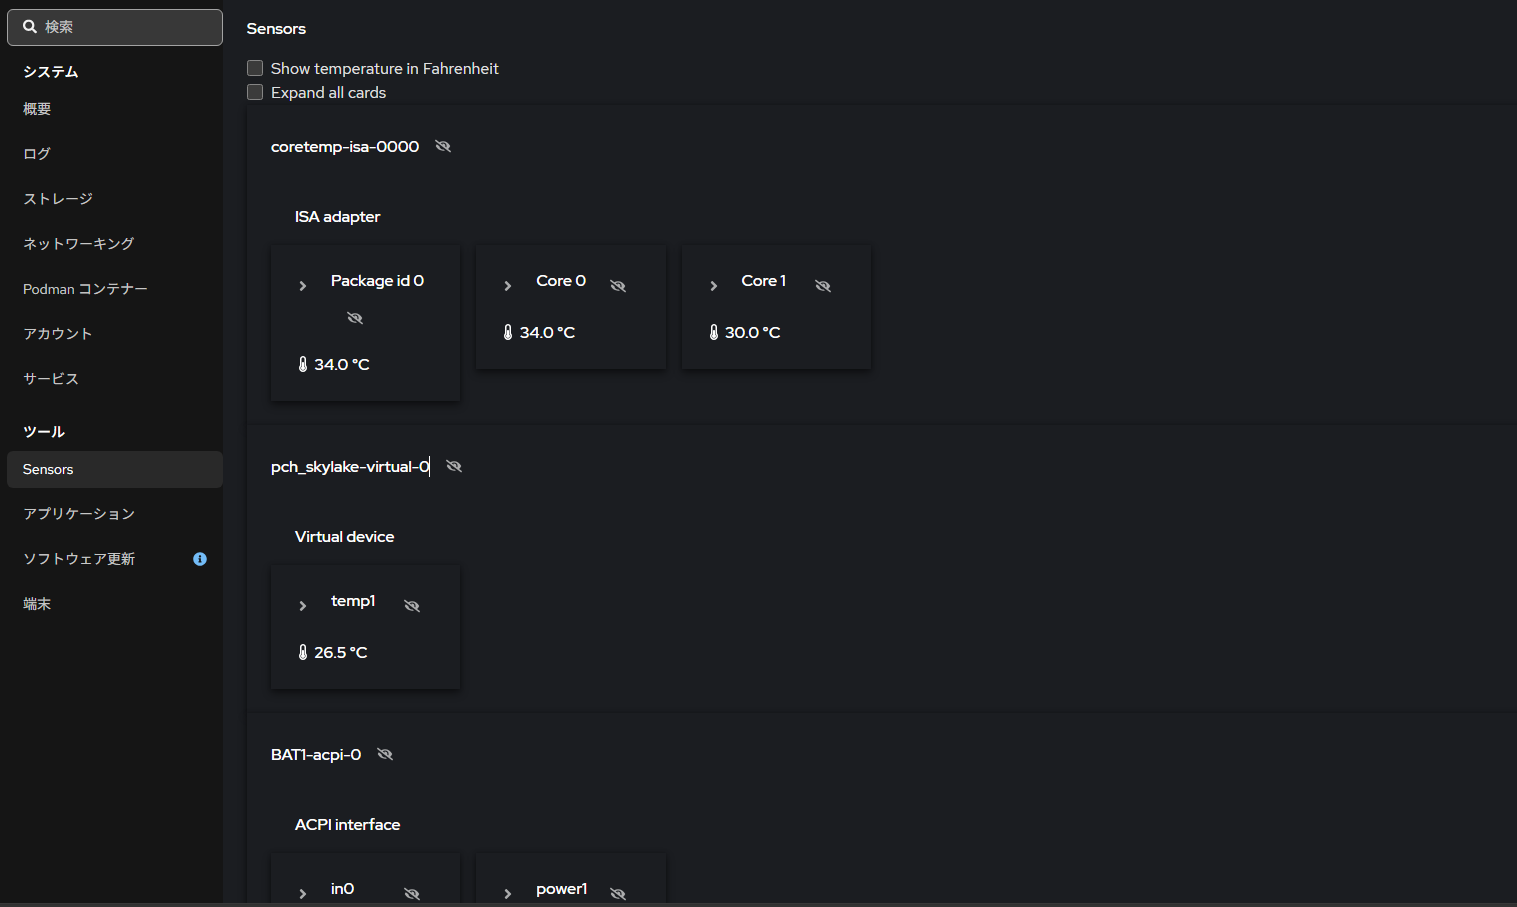
Since this is considered a display defect caused by CSS or container style specifications on the plugin side (such as overflow settings), we plan to cover code fixes to resolve this scrolling issue in detail in a future verification article.
Conclusion
Drawing from the lesson of past CPU thermal runaway caused by a fan failure, we introduced Cockpit and the third-party plugin cockpit-sensors to our Ubuntu Server 26.04 environment. By manually deploying a plugin not found in the official apt repository, we established an environment where we can remotely monitor the temperature of each CPU core in real time from a browser. Since an issue was identified where screens on certain multi-function machines could not scroll vertically and information was cut off, fixing the plugin’s display adjustments will be a future improvement task.