[Operation Report] 1 Year Since Blog Launch: What Happened to Traffic and Revenue After Writing One Article Every 4 Days?
Hello, this is Nando Kobo. It has been about a year since we launched donguri3.net as a “personal experimental ground" for those who love making things and technology.
“Even without a spacious room, ideas and possibilities lie dormant in the nando (storeroom)." With that feeling in mind, I’ve been archiving DIY projects, server setups, and niche troubleshooting articles. To mark our 1st anniversary, I’d like to summarize the “real numbers" behind running this blog.
I hope this serves as a helpful reference for anyone looking to start a blog, or anyone curious about what a “tech blog is really like."
Goal Achieved: The “Every 4 Days" Promise
First off, I set a strict rule for myself when running this blog: “Post at least one article every 4 days (around 100 articles a year)."
Coming up with topics alone is a challenge for a tech blog, but here are the results after running for a full year:
- Period: November 26, 2024 – January 12, 2026
- Number of published articles: 124
- Average posting pace: Roughly one article every 3.3 days
I successfully achieved the goal of “one article every 4 days," accumulating articles at a pace of better than once every 3 days on average. Rather than giving up after three days, I managed to put 124 “storeroom ideas" out into the world. First and foremost, I want to genuinely take pride in this achievement of consistency.
Traffic Analysis: Two “Jumps"
They say persistence pays off, but how did actual traffic change? Let’s take a look at the Google Search Console data.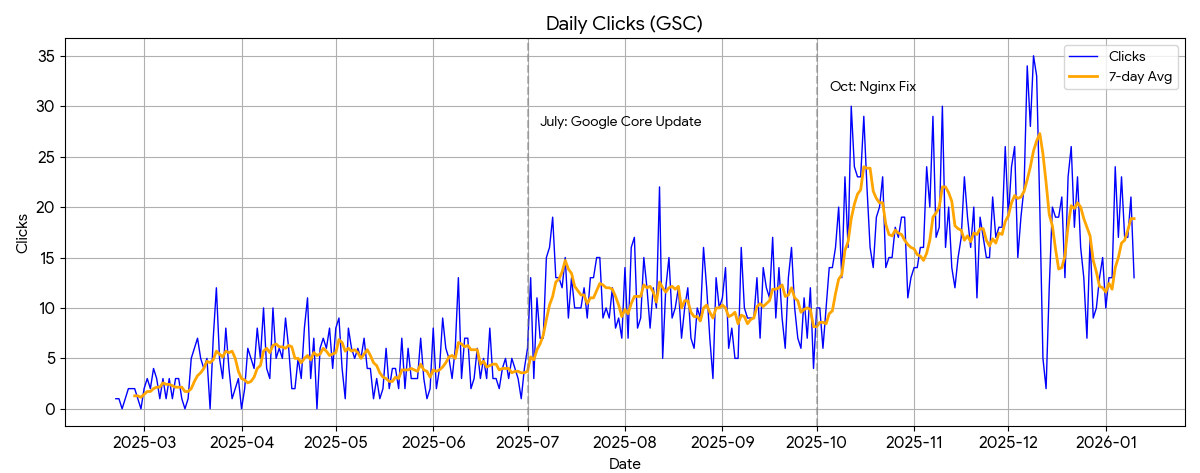
Looking at the graph, you can see not just steady growth, but clear traffic “steps (jumps)" in July and October. There were clear reasons for this.
- July Surge (Google Core Update): Monthly clicks surged to about 2.5 times the previous month. Timing-wise, this is thought to be the effect of Google’s search algorithm change (Core Update). It was a gratifying moment when the steadily accumulated articles began to be recognized by search engines as “valuable information."
- October Surge (Optimization of Server Settings): An even bigger wave hit in October. Actually, this was driven by “infrastructure improvements" rather than article content. Up until then, there were issues with traffic control to the home server, and WordPress’s speed optimization plugin (LiteSpeed Cache) wasn’t functioning properly. To fix this, I changed the traffic gateway from iptables to an Nginx reverse proxy, configuring it to properly pass along visitor source information. As a result, the site’s response speed and health improved, which directly translated to higher search rankings. It was a deeply rewarding experience for an engineer—proof that “server technical prowess boosts SEO."
Revenue Trends: The Potential of 70 Yen and the “Weekday" Rule
Next, let’s talk about the revenue (Google AdSense) everyone is curious about.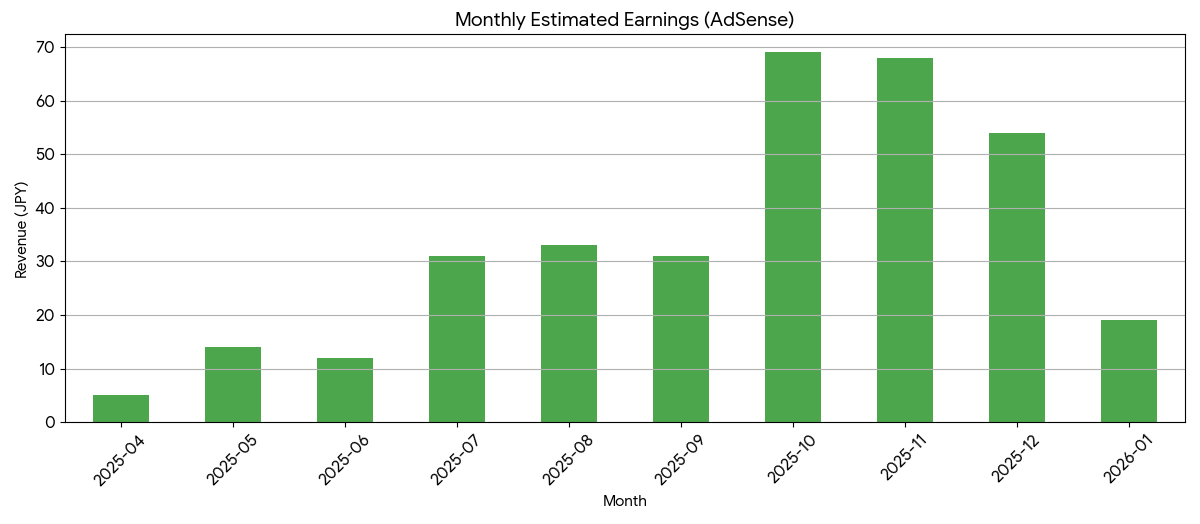
- Started blogging: November 26, 2024
- Passed Google AdSense review: April 28, 2025
- Total estimated revenue as of January 12, 2026: 336 yen
- Recent monthly revenue: Around 70 yen (Actuals for October & November 2025)
As you can see from the graph, months of “0 yen" and “1 yen" continued at first, but with the increase in traffic, the past few months have grown to around 70 yen per month.
Why Did December Drop? An “Interesting Hypothesis" Revealed by the Data
Compared to a steady October and November (around 70 yen), December dipped slightly to 54 yen. Worried that “the blog was losing momentum?", I analyzed the data in detail and found an extremely interesting characteristic in the behavior of our readership.
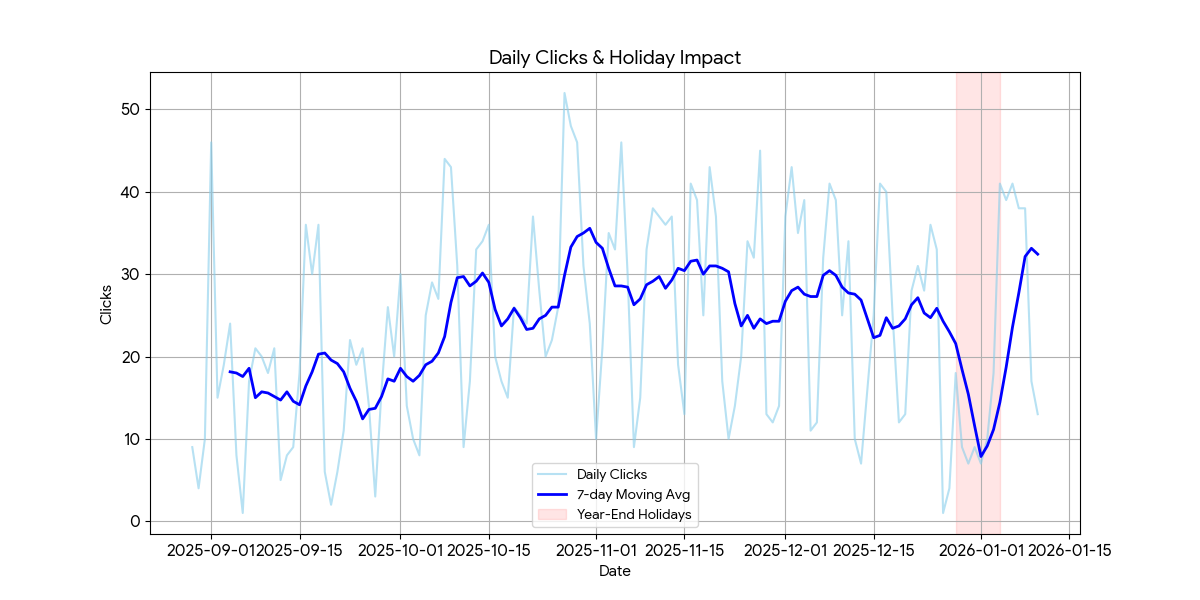
- Discrepancy Between Weekdays and Weekends
- Average weekday clicks: Approx. 27
- Average weekend clicks: Approx. 15
- There is a roughly 1.7x gap, with the blog clearly being read more on “weekdays."
- Traffic Drop During Long Holidays
- Traffic during the New Year holidays (December 29 – January 3) dropped to single digits.
- However, starting Monday, January 5—the first day back at work—it experienced a V-shaped recovery straight back into the 40s.
What does this data mean? Normally, for a hobby or entertainment blog, traffic should increase precisely on weekends and consecutive holidays. However, the traffic trend of Nando Kobo moves as if it’s synchronized with a corporate business calendar.
From this, a hypothesis emerges: “Could it be that engineers research technical info during weekday downtime, and focus on hands-on work during the weekends?"
During weekday commutes or breaks, they do their design and preparation—thinking, “Let’s mess with that server next weekend," or “What’s causing the error on that part?" Then, when the weekend actually arrives, they immerse themselves in hands-on work (implementation) in front of their PCs rather than searching online. If this assumption is correct, this blog may be acting like an operational base supporting the intellectual curiosity and prep work of “weekday research-type" engineers.
What Kinds of Articles Are Being Read?
Here are the top 3 most popular articles on Nando Kobo:
- Mini PC + PT3 Recording Server Build
A deeply romantic article about running the “PT3" tuner card—which still maintains a fiercely loyal following—on a modern mini PC. - Resolving AMD Ryzen Master Driver Errors
Troubleshooting driver-related issues that occur when upgrading to Windows 11. Solving “headaches" for custom PC builders worldwide. - Raspberry Pi 3 + PiKVM
An article on building an IP-KVM (remote operation terminal) using an affordable Raspberry Pi. Widely read by server administrators and electronics hobbyists.
While all of these are niche, they are essentially “records of my own troubles and how I solved them." The numbers show that these logs are genuinely helping someone out.
Future Goals: Breaking Even
My goal for the second year is simply set:
- Goal: Cover domain renewal costs (approx. 2,000 yen/year) with blog revenue
Currently, the costs required to run the blog are as follows:
- Domain cost: Approx. 2,000 yen/year
- Server cost: 0 yen (Using Oracle Cloud’s free tier, shared with home NAS)
- Electricity cost: Practically negligible as it’s shared with the home NAS
- Line cost: Utilizing the home internet line as-is (load is minimal)
In other words, as long as I can make 2,000 yen a year, this blog becomes a “fully self-sustaining perpetual motion machine." At the current pace of 70 yen per month, that comes out to 840 yen a year, so we aren’t quite there yet, but it’s a fully achievable figure given our room for traffic growth.
Summary: Blogs Are Fun Laboratories
What did you think of our 1-year operation report? I didn’t start this with the goal of monetization, but by organizing my own interests and insights, it somehow ended up being read by people all over the world and returning value to me, little by little.
“Just writing down the things you love might earn you enough for lunch money." When you think about it that way, don’t you think running a blog is a remarkably dreamy hobby?
Nando Kobo will continue its experiments in a corner of the vast internet to stimulate someone’s curiosity. Why don’t you try opening a “workshop" of your own?